Predicting 8 Diseases from 5 Symptoms with Orange Data Mining
A data mining mini-project from my Master’s in AI and Data Science
Can a handful of symptoms be enough to tell eight common diseases apart? That was the question behind this mini-project for my Data Mining module. My teammate and I built a full workflow in Orange, from raw data to a readable decision tree, and this post walks through what we did and what we learned.
The problem
Given five clinical symptoms, predict which of eight conditions a patient has:
- Inputs: Fever (in °F), Headache, Cough, Fatigue and Body Pain (each on a 0–10 scale)
- Target: Disease, with 8 classes: Common Cold, Malaria, Cough, Asthma, Normal Fever, Body Ache, Runny Nose and Dengue
This is a multiclass classification problem. It is also a good excuse to use the whole data mining chain: exploration, preprocessing, feature analysis, supervised learning, unsupervised learning and knowledge extraction.
The dataset
The data is synthetic: 5,000 patients generated with NumPy and Pandas, designed to follow realistic links between symptoms and diseases. It has 6 columns, no missing values, and is perfectly balanced, with 625 patients per disease (12.5% each).
That last point matters. Balanced classes remove one common source of bias and make accuracy a fair metric. It also means we should be careful about how far these results generalize, which I come back to at the end.
Why Orange?
Orange is a visual, workflow-based data mining tool. You connect widgets on a canvas instead of writing code, and every step stays inspectable. For a project where we wanted to compare many techniques quickly, it was a good fit.
Our workflow chained these stages:
- File, Data Info, Data Table to load and inspect
- Box Plot, Scatter Plot, Mosaic Display, Column Statistics for exploration
- Outliers, Impute, Preprocess for cleaning
- Rank, Linear Projection, Heat Map, PCA for feature analysis
- Test and Score, Confusion Matrix, ROC Analysis for supervised evaluation
- k-Means, Hierarchical Clustering, Tree for unsupervised learning and rules
Exploring the data
Fever is tightly concentrated, with a mean of about 99.8°F, while the four subjective symptoms are much more spread out (means between 2.6 and 5.1). Body Pain has the widest spread and a low median (about 1.6), so most patients report little pain while a few report a lot.
The scatter plot of Fever against Headache shows what you would expect clinically: high temperatures (above 103°F) come with stronger headaches, especially for Dengue and Malaria. The mosaic display shows Body Pain standing out for Body Ache.
Preprocessing
- Outliers: Local Outlier Factor (20 neighbors, 10% contamination, Euclidean distance) flagged 431 patients, about 8.6%. We did not remove them automatically. In a medical setting an unusual symptom combination may be a rare but real severe case.
- Missing values: none, but we kept an Impute widget in the workflow so the pipeline would still work on incomplete data.
- Normalization: we standardized every feature (mean 0, standard deviation 1). Without it, Fever, with values around 100, would dominate any distance-based method such as k-NN or k-means.
Which symptoms matter most?
The Rank widget scored each feature with Information Gain, Gini Decrease, ANOVA and ReliefF. The ordering was fairly consistent:
- Fever
- Body Pain
- Headache
- Fatigue
- Cough
Cough ranks last because it shows up at moderate levels in several diseases (Common Cold, Asthma, Cough) without being specific to any one of them. Still, every feature carried useful signal, so we kept all five.
The heat map showed only moderate correlations between symptoms and none above 0.8, so there was no serious redundancy to remove.
PCA: how much structure is there?
Two principal components explain about 79% of the variance (roughly 60% for PC1 and 19% for PC2). In the 2D projection, the febrile diseases (Dengue, Malaria) sit apart from the non-febrile ones, Body Ache forms a tight group, and Common Cold and Asthma overlap. That overlap foreshadows the errors we see later.
Six classifiers, one winner
We compared six models with 10-fold cross-validation:
| Model | Accuracy | AUC | Training time |
|---|---|---|---|
| Random Forest | 0.944 | 0.978 | 7.2 s |
| Neural Network | 0.927 | 0.969 | 32.2 s |
| k-NN | 0.923 | 0.960 | 0.14 s |
| Logistic Regression | 0.904 | 0.950 | 1.7 s |
| Naive Bayes | 0.884 | 0.934 | 0.07 s |
| SVM | 0.880 | 0.924 | 3.9 s |
Random Forest wins on accuracy and AUC. k-NN is the pragmatic runner-up: almost as accurate and trained in a fraction of a second. The Neural Network is competitive but about 4 times slower than Random Forest for lower scores.
Where the errors are
The confusion matrix is more informative than the headline accuracy:
- Body Ache: 625 of 625 correct (100%)
- Dengue and Malaria: 99% and 98.4% correct, with only a few swaps between them
- Normal Fever and Runny Nose: 95.8% and 97.9% correct
- Cough: 74.6% correct, mostly confused with Asthma (144 cases)
- Common Cold: only 69.9% correct, confused with Asthma (133 cases)
So the hard part is not telling a severe fever from a mild cold. It is separating the respiratory conditions that share cough-like symptoms.
Clustering without labels
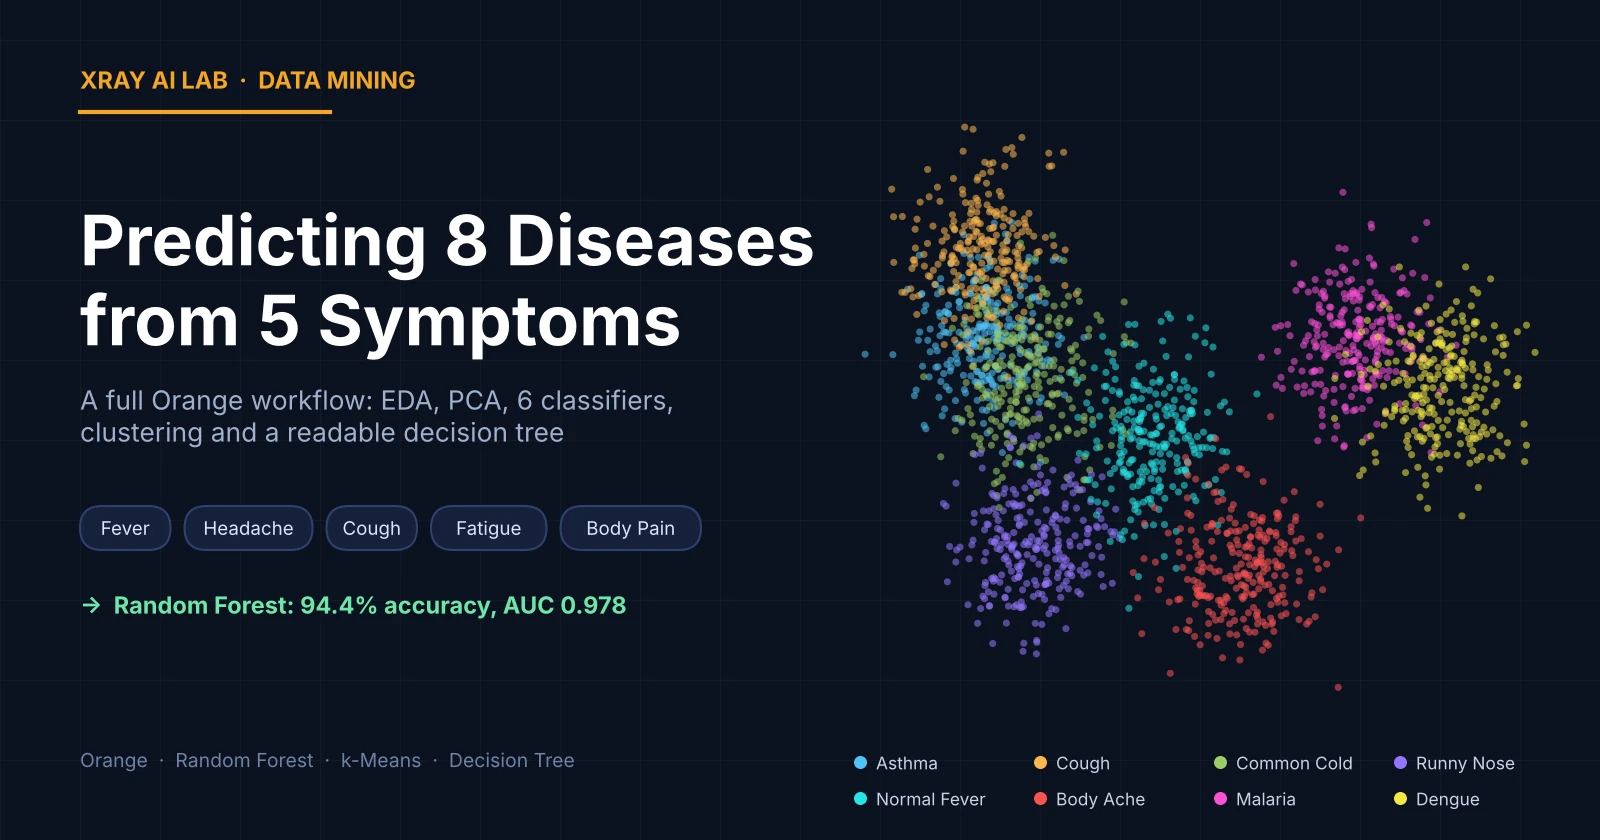
If we hide the diseases, do the patients still group by disease? We ran k-means with 8 clusters (k-means++ initialization, 10 re-runs, normalized columns) and projected the result on the first two principal components. The clusters line up well with the diseases: Body Ache, Dengue and Malaria form compact groups, while Asthma, Common Cold and Cough blur together, exactly where the classifiers struggled. The silhouette plot told the same story.
Hierarchical clustering (normalized Euclidean distance, average linkage) added a useful view. The dendrogram separates febrile from non-febrile conditions first, then splits within each branch, and Asthma and Cough tend to merge early.
A decision tree you can read
Black-box accuracy is not enough in healthcare, so we also built a decision tree (binary splits, maximum depth 5, stop at 95% purity). It has 31 nodes and 16 leaves, and it reads like a clinical checklist:
- Fever above about 99.5°F and Body Pain above about 6/10: Body Ache (100%)
- High fever, high fatigue, little cough: Malaria (100%)
- No high fever, strong cough, fatigue: Common Cold (100%)
- No high fever, strong cough, no fatigue: Runny Nose (100%)
- No high fever, little cough, no fatigue: Normal Fever (95.8%)
Fever is the first split, Body Pain isolates Body Ache, and Cough plus Fatigue separate the milder conditions. This is the kind of output a non-specialist can verify by eye, which is the main reason to prefer a tree over a forest when explainability matters.
What I’d be careful about
- The data is synthetic. The classes are generated from rules, so they are cleaner than real patients. A 94% score here does not mean 94% in a clinic.
- Symptoms are subjective. Real self-reported scores are noisier than simulated ones.
- This is not a diagnostic tool. It is a learning project. A real system would need clinical data, clinical validation and medical oversight.
- Accuracy hides class differences. The 100% on Body Ache and 69.9% on Common Cold average out to a flattering number.
What I learned
- Visual tools like Orange are excellent for comparing many methods fast and for explaining results.
- Supervised and unsupervised results agreeing with each other is strong evidence that the structure is real, and that the confusions are inherent to the data rather than a model bug.
- The simplest model is often good enough: k-NN came within about two points of Random Forest in accuracy at a tiny training cost.
- Interpretability and accuracy do not have to be an either-or choice. Use the forest to see what is achievable, and the tree to explain it.
— Xray AI Lab