Python for Data Science: A Beginner’s Guide
Learn Python for data science from scratch: core syntax, NumPy, Pandas, Matplotlib, Seaborn, scikit-learn, a student scores project, and a learning roadmap.
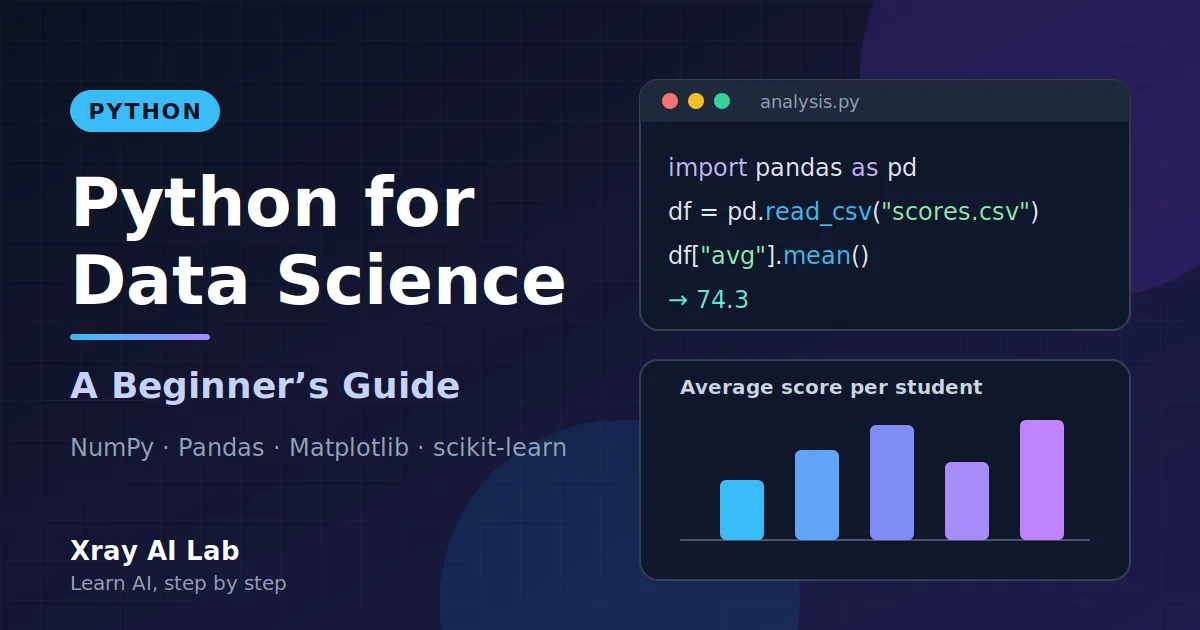
Every data science project starts with the same quiet problem: you have data, and you need to turn it into something you can understand. It might be a spreadsheet of exam results, a log of website visits, or thousands of sensor readings. You need to load it, clean it, summarize it, draw it, and sometimes teach a computer to predict from it. Python is the language that lets you do all of that in one place.
Python is not the only tool for working with data. SQL, R, Julia, and spreadsheets are all useful, and many teams combine them. But Python has a combination that is hard to beat for beginners: readable syntax, a huge ecosystem of free libraries, interactive notebooks, and a large community that has already answered most of the questions you will ask. The same skills carry on into machine learning, deep learning, computer vision, and generative AI, because the major libraries in those fields are built for Python.
This guide takes you from “I have never written code” to “I can analyze a small dataset and read my own report”. You will learn the core language, meet the main data science libraries, and finish with a complete mini-project that analyzes a fictional set of student scores. The Python examples in this article were run, and the printed output shown is the real output.
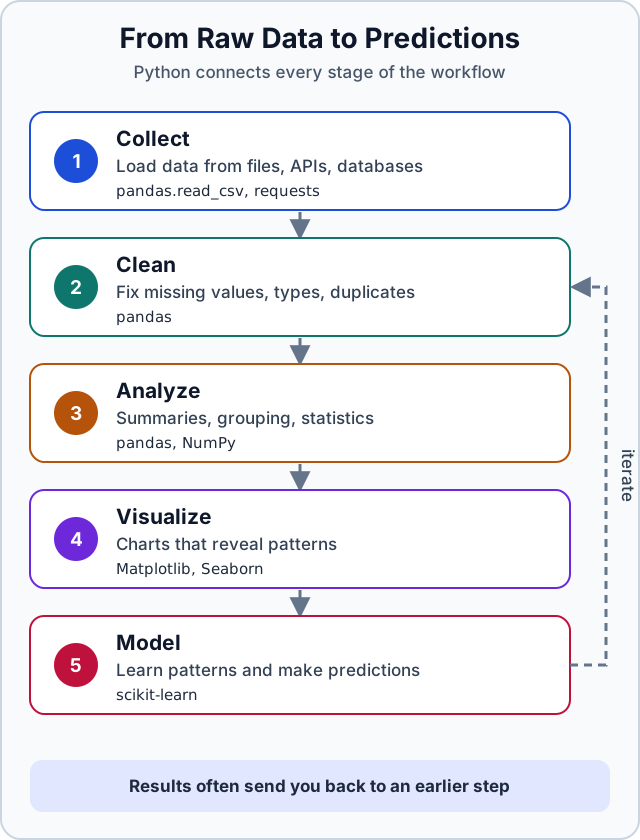
What you need: a computer or phone with a browser, a free Google account (for Colab) or a VS Code installation, and about an hour for each major section. No math beyond school-level arithmetic is required.
Table of Contents
- What Python Is and Why It Is Useful
- Running Python with Google Colab or VS Code
- Variables and Basic Data Types
- Strings, Integers, Floats, and Booleans
- Lists, Tuples, and Dictionaries
- Conditions and Comparison Operators
- Loops
- Functions
- Introduction to NumPy, Pandas, Matplotlib, Seaborn, and Scikit-learn
- Mini-Project: Student Score Analyzer
- Common Beginner Mistakes and How to Fix Them
- A Realistic Learning Roadmap
- Conclusion
- Further Reading
What Python Is and Why It Is Useful
Python is a general-purpose programming language created by Guido van Rossum and first released in 1991. “General-purpose” means it is used for many things: websites, automation scripts, scientific computing, and artificial intelligence. It is an interpreted language, which means you can run code line by line and see results immediately. That is ideal for exploring data.
Here is why Python works so well for data science:
- Readable syntax. Python code often reads close to plain English, so you spend your effort on the problem rather than on punctuation.
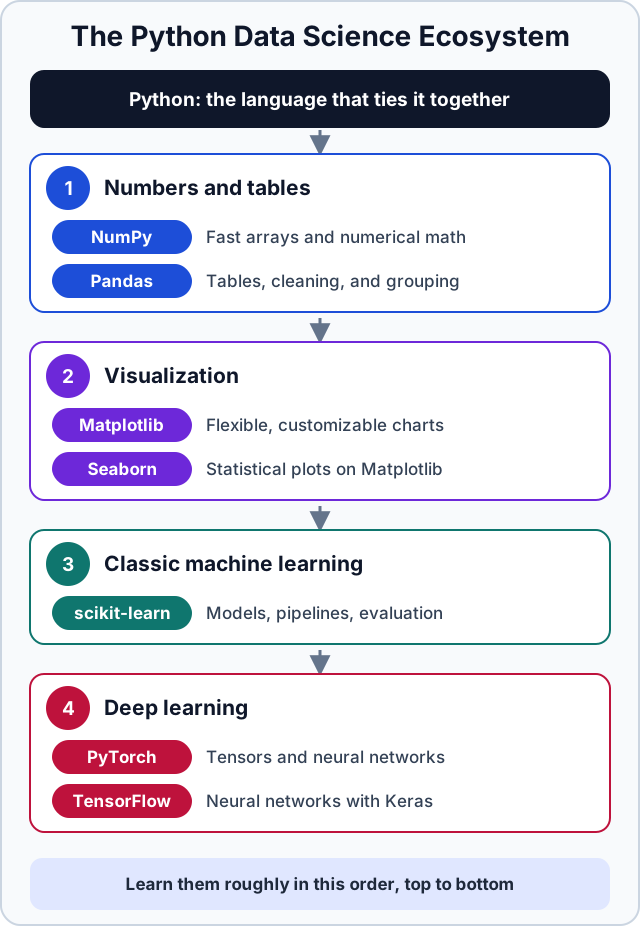
- A rich library ecosystem. Libraries such as NumPy, Pandas, Matplotlib, Seaborn, and scikit-learn provide tested, fast tools for common tasks, so you do not need to write them yourself.
- Interactive notebooks. Tools like Jupyter and Google Colab let you mix code, results, charts, and notes in one document.
- A clear path to advanced topics. PyTorch and TensorFlow, the two best-known deep learning frameworks, are used primarily from Python.
- An active community. Excellent free documentation and countless tutorials exist, and most error messages can be searched and solved.
Python does have trade-offs. Plain Python loops are slower than compiled languages, which is why data libraries perform heavy calculations in optimized code underneath. For a beginner, that detail rarely matters; it simply explains why we use NumPy and Pandas instead of writing everything from scratch.
Running Python with Google Colab or VS Code
You can write Python in many places. Two beginner-friendly options are Google Colab and Visual Studio Code (VS Code). You do not have to choose permanently; many people use both.
Option 1: Google Colab (no installation)
Google Colab is a free, browser-based notebook environment. It is the fastest way to start because nothing needs to be installed.
- Open colab.research.google.com and sign in with a Google account.
- Choose New notebook.
- Click into the first code cell, type the code below, and press Shift + Enter to run it.
print("Hello, data science!")Hello, data science!Colab notebooks are made of cells. Code cells run Python, and text cells hold notes written in Markdown. Colab typically comes with NumPy, Pandas, Matplotlib, Seaborn, and scikit-learn already installed, so you can import them immediately. If a library is missing, install it in a cell with !pip install library-name.
Option 2: VS Code on your computer
VS Code is a free code editor that works on Windows, macOS, and Linux. It is a good choice when you want to build real projects, use Git, and keep files organized.
- Install Python 3 from python.org (on Windows, tick “Add Python to PATH” in the installer).
- Install VS Code and add the official Python extension from the Extensions panel.
- Create a project folder and open it in VS Code.
- Open the integrated terminal and create a virtual environment, which keeps each project’s libraries separate:
python -m venv .venv- Activate it. On Windows use
.venv\Scripts\activate. On macOS or Linux usesource .venv/bin/activate. - Install the libraries used in this article:
pip install numpy pandas matplotlib seaborn scikit-learn- Create a file named
hello.pycontainingprint("Hello, data science!"), then runpython hello.pyin the terminal.
On some systems the commands are python3 and pip3, or py on Windows. If one version does not work, try the other. If you prefer notebooks inside VS Code, the Jupyter extension lets you run .ipynb files there too.
Variables and Basic Data Types
A variable is a name that refers to a value. You create one with the equals sign, which in Python means “assign”, not “is equal to”.
name = "Amina"
age = 24
score = 87.5
passed = True

print(name, age, score, passed)
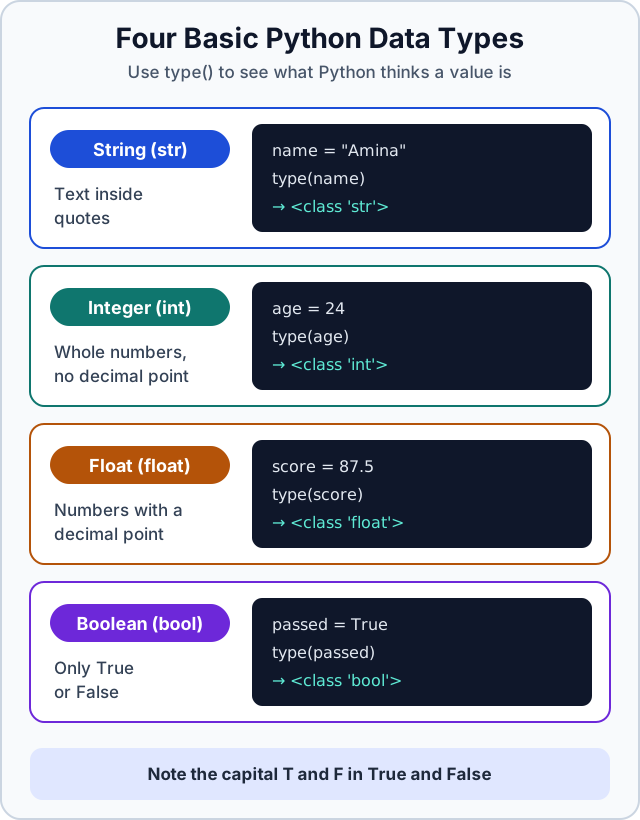
Amina 24 87.5 TrueEvery value has a type, which tells Python what you can do with it. You can inspect it with the built-in type() function.
print(type("Amina"))
print(type(24))
print(type(87.5))
print(type(True))
<class 'str'>
<class 'int'>
<class 'float'>
<class 'bool'>Some good habits for naming variables:
- Use lowercase letters with underscores, a style called
snake_case(for examplemath_score). - Choose descriptive names.
average_scoreis clearer thana. - Names cannot start with a digit or contain spaces, and they are case-sensitive:
Scoreandscoreare different variables. - Avoid reusing built-in names such as
list,sum, ormaxas variable names.
Python is dynamically typed: you do not declare a variable’s type in advance, and the same name can later refer to a value of a different type. That is convenient, but it also means you should keep track of what each variable holds.
Strings, Integers, Floats, and Booleans
These four types are the building blocks of nearly every program.
type() for each.Strings (str)
A string is text, written inside single or double quotes. Strings come with many helpful methods.
first_name = "Amina"
greeting = "Hello, " + first_name

print(greeting)
print(first_name.upper())
print(len(first_name))
print(f"{first_name} scored {87.5:.1f} points")
Hello, Amina
AMINA
5
Amina scored 87.5 pointsThe last line uses an f-string: a string that starts with f and lets you place variables and formatting inside curly braces. :.1f means “show one digit after the decimal point”. F-strings are the cleanest way to build readable output and you will use them constantly.
Integers (int) and floats (float)
Integers are whole numbers. Floats have a decimal point. Python supports the usual arithmetic operators.
a = 17
b = 5

print(a + b)    # addition
print(a - b)    # subtraction
print(a * b)    # multiplication
print(a / b)    # division always gives a float
print(a // b)   # floor division
print(a % b)    # remainder
print(a ** 2)   # power
22
12
85
3.4
3
2
289Floats are stored in binary, so some decimal fractions cannot be represented exactly. This is not a Python bug; it happens in almost every language.
print(0.1 + 0.2)
print(round(0.1 + 0.2, 2))
0.30000000000000004
0.3You can convert between types with int(), float(), and str(). Note that int() cuts off the decimal part rather than rounding.
print(int("42") + 1)
print(float("3.5"))
print(int(3.9))
print(str(100) + " points")
43
3.5
3
100 pointsBooleans (bool)
A boolean is either True or False (with capital first letters). Comparisons produce booleans, and they drive the decisions in your programs.
score = 72

print(score >= 60)
print(score == 100)
print(bool(0), bool(""), bool("text"), bool([]))
True
False
False False True FalseThe last line shows truthiness: zero, empty strings, and empty collections count as False, while most other values count as True. You do not need to memorize this now, but it explains some behavior you will meet later.
Lists, Tuples, and Dictionaries
Real data comes in collections, not single values. Python has three collection types you will use every day.
Lists
A list is an ordered, changeable collection. Positions start at 0, and negative positions count from the end.
scores = [92, 75, 58, 85]

print(scores[0])
print(scores[-1])

scores.append(99)
print(scores)
print(len(scores))
print(scores[1:3])
print(sum(scores) / len(scores))
92
85
[92, 75, 58, 85, 99]
5
[75, 58]
81.8The expression scores[1:3] is a slice: it starts at position 1 and stops just before position 3.
Tuples
A tuple is like a list that cannot be changed after creation. Use it for fixed groups of values, such as coordinates.
point = (3, 4)
x, y = point

print(x, y)
print(point)
3 4
(3, 4)Dictionaries
A dictionary stores key-value pairs. Instead of remembering that position 2 holds the science score, you look it up by name.
student = {"name": "Amina", "math": 92, "science": 88}

print(student["name"])

student["english"] = 79
print(student)
print(student.get("history", "not recorded"))
Amina
{'name': 'Amina', 'math': 92, 'science': 88, 'english': 79}
not recordedThe .get() method returns a default value instead of raising an error when a key is missing. A list of dictionaries, where each dictionary describes one row, is a natural way to represent a small table. It is the structure the mini-project below uses, and it is also very close to how Pandas organizes data.
Conditions and Comparison Operators
Programs make decisions with if, elif (short for “else if”), and else. The code that belongs to each branch is indented by four spaces.
score = 72

if score >= 90:
    print("Excellent")
elif score >= 60:
    print("Pass")
else:
print("Needs more practice")PassPython checks the conditions from top to bottom and runs only the first branch that is true.
| Operator | Meaning | Example | Result |
|---|---|---|---|
== | equal to | 5 == 5 | True |
!= | not equal to | 5 != 3 | True |
> | greater than | 3 > 5 | False |
< | less than | 3 < 5 | True |
>= | greater than or equal to | 5 >= 5 | True |
<= | less than or equal to | 6 <= 5 | False |
You can combine conditions with and, or, and not, and test membership with in.
score = 72
attendance = 0.9

print(score >= 60 and attendance >= 0.8)
print(score < 50 or attendance > 0.95)
print(not score >= 60)
print("math" in {"math": 92, "science": 88})
True
False
False
TrueLoops
A loop repeats a block of code. Loops are how you process every row of a dataset without writing the same line a thousand times.
The for loop
Use for to go through the items of a collection.
scores = [92, 75, 58, 85]

total = 0
for score in scores:
    total += score

print(total)
print(total / len(scores))
310
77.5The shortcut total += score means total = total + score. When you need both the position and the value, use enumerate():
scores = [92, 75, 58, 85]

for number, score in enumerate(scores, start=1):
    print(f"Student {number}: {score}")
Student 1: 92
Student 2: 75
Student 3: 58
Student 4: 85The while loop
A while loop keeps running as long as its condition is true. Make sure something inside the loop eventually makes the condition false, or it will never stop.
attempts = 0

while attempts < 3:
    attempts += 1
    print("Attempt", attempts)
Attempt 1
Attempt 2
Attempt 3List comprehensions
A list comprehension builds a new list in a single line. This one keeps only the passing scores:
scores = [92, 75, 58, 85]
passing = [s for s in scores if s >= 60]

print(passing)
[92, 75, 85]Comprehensions are optional at first. If they feel confusing, write the equivalent for loop, which does the same thing, and return to comprehensions later.
Functions
A function is a named, reusable block of code. Functions make programs shorter, easier to test, and easier to read. You define one with def, give it parameters (inputs), and send a result back with return.
def average(values):
    """Return the mean of a list of numbers."""
    return sum(values) / len(values)


def result(score, pass_mark=60):
    """Return 'Pass' or 'Fail' for a score."""
    if score >= pass_mark:
        return "Pass"
    return "Fail"


print(average([92, 75, 58, 85]))
print(result(58))
print(result(58, pass_mark=50))
77.5
Fail
PassA few points worth remembering:
- The text in triple quotes right after the
defline is a docstring. It documents what the function does. pass_mark=60is a default value. Callers can skip it or override it by name.returnhands a value back to the caller.print()only displays something on screen. A function that prints but does not return gives you nothing to use in later calculations.
Introduction to NumPy, Pandas, Matplotlib, Seaborn, and Scikit-learn
Plain Python is enough for small tasks, but real data work relies on libraries. Each of the five below has a specific job. You do not need to master them yet; the goal here is to recognize what each one is for and see a first working example.
NumPy: fast numerical arrays
NumPy provides the ndarray, an efficient array type, along with fast mathematical operations. Many other libraries are built on it.
import numpy as np

scores = np.array([92, 75, 58, 85])

print(scores.mean())
print(scores * 2)
print(scores[scores >= 60])
77.5
[184 150 116 170]
[92 75 85]Notice that scores * 2 doubles every element at once, with no loop. This vectorized style is faster and shorter than looping manually. The last line filters the array with a condition.
Pandas: tables of data
Pandas gives you the DataFrame, a table with labeled columns. It reads and writes CSV and Excel files and handles cleaning, filtering, grouping, and summarizing.
import pandas as pd

df = pd.DataFrame({
    "name": ["Amina", "Youssef", "Salma", "Omar"],
    "math": [92, 75, 58, 85],
    "science": [88, 81, 64, 90],
})

df["average"] = df[["math", "science"]].mean(axis=1)

print(df)
print(df["average"].max())
name math science average
0 Amina 92 88 90.0
1 Youssef 75 81 78.0
2 Salma 58 64 61.0
3 Omar 85 90 87.5
90.0To load your own data you would typically write pd.read_csv("my_file.csv").
Matplotlib: charts you control
Matplotlib is the foundational plotting library. It can draw almost any chart, and many other plotting tools build on it.
import matplotlib.pyplot as plt

names = ["Amina", "Youssef", "Salma", "Omar"]
math_scores = [92, 75, 58, 85]

plt.bar(names, math_scores)
plt.title("Math scores")
plt.ylabel("Score")
plt.show()
This code displays a bar chart in your notebook or in a separate window.
Seaborn: statistical charts with less code
Seaborn is built on top of Matplotlib. It gives you attractive defaults and ready-made statistical plots that work directly with Pandas DataFrames.
import pandas as pd
import seaborn as sns
import matplotlib.pyplot as plt

df = pd.DataFrame({
    "name": ["Amina", "Youssef", "Salma", "Omar"],
    "average": [90.0, 78.0, 61.0, 87.5],
})

sns.set_theme()
sns.barplot(data=df, x="name", y="average")
plt.title("Average score per student")
plt.show()
Scikit-learn: classic machine learning
scikit-learn offers a consistent interface for preparing data, training models, and evaluating them. The pattern is always the same: create a model, call .fit() to learn from data, and call .predict() to make predictions.
The tiny example below learns the relationship between hours studied and test score. It is far too small to be a real model, but it shows the workflow.
from sklearn.linear_model import LinearRegression

hours = [[1], [2], [3], [4], [5]]   # inputs must be 2D: rows x features
scores = [52, 58, 65, 70, 78]

model = LinearRegression()
model.fit(hours, scores)

print(round(model.coef_[0], 1))
print(round(model.predict([[6]])[0], 1))
6.4
83.8The model estimates that each extra hour adds about 6.4 points, and predicts roughly 83.8 for a student who studies 6 hours. In real projects you would use much more data, split it into training and testing sets, and measure how well the model performs on data it has not seen.
Where PyTorch and TensorFlow fit
PyTorch and TensorFlow are frameworks for deep learning, the neural-network side of AI used in computer vision, language models, and generative AI. They come after the five libraries above, once you are comfortable with data and basic machine learning.
Mini-Project: Student Score Analyzer
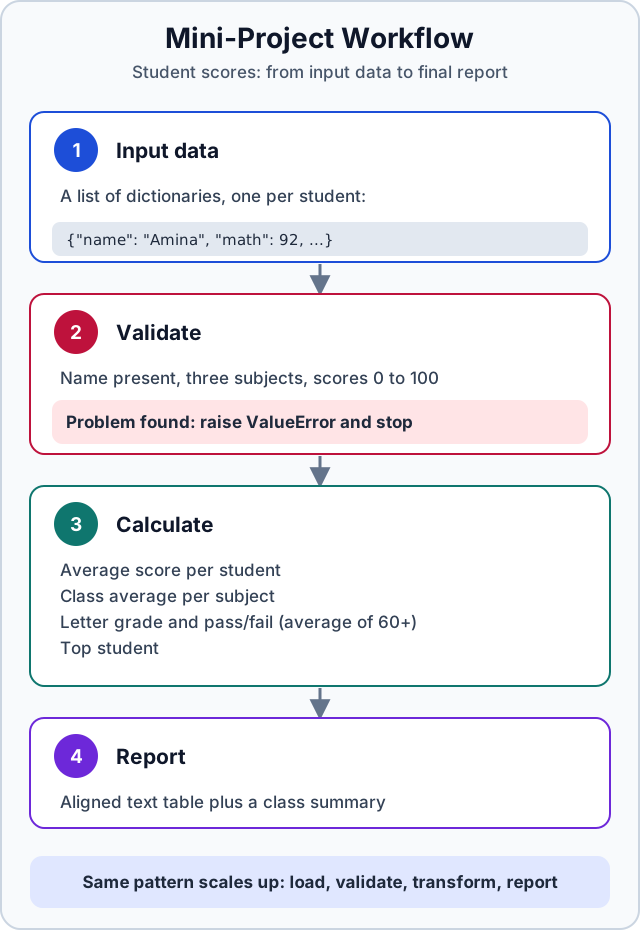
Time to combine everything. In this project you will analyze a fictional class of eight students who took three tests: math, science, and English. The data is invented for learning purposes and does not represent real students.
What the program does
- Stores the scores as a list of dictionaries.
- Validates the data, so bad input produces a clear error instead of a wrong report.
- Calculates each student’s average, letter grade, and pass/fail result, plus the class average for each subject.
- Prints a formatted report with a summary.
A student passes when their average is at least 60 (PASS_MARK). The grading scale is A for 90 and above, B for 80 to 89, C for 70 to 79, D for 60 to 69, and F below 60. Averages are compared before rounding, so a score displayed as 89.7 is still a B.
The complete code
Save this as student_scores.py and run it with python student_scores.py. It uses only built-in Python, so it needs no installed libraries.
"""Student score analyzer: validate, calculate, and report."""

SUBJECTS = ["math", "science", "english"]
PASS_MARK = 60

students = [
    {"name": "Amina",   "math": 92, "science": 88, "english": 79},
    {"name": "Youssef", "math": 75, "science": 81, "english": 68},
    {"name": "Salma",   "math": 58, "science": 64, "english": 71},
    {"name": "Omar",    "math": 85, "science": 90, "english": 94},
    {"name": "Lina",    "math": 67, "science": 55, "english": 62},
    {"name": "Karim",   "math": 99, "science": 95, "english": 87},
    {"name": "Nadia",   "math": 44, "science": 52, "english": 58},
    {"name": "Hamza",   "math": 73, "science": 70, "english": 77},
]


def validate(records):
    """Raise ValueError if any record is incomplete or out of range."""
    for record in records:
        name = record.get("name")
        if not name:
            raise ValueError(f"Record without a name: {record}")
        for subject in SUBJECTS:
            if subject not in record:
                raise ValueError(f"{name} is missing the {subject} score")
            score = record[subject]
            if isinstance(score, bool) or not isinstance(score, (int, float)):
                raise ValueError(f"{name}: {subject} score must be a number, got {score!r}")
            if not 0 <= score <= 100:
                raise ValueError(f"{name}: {subject} score {score} is outside 0-100")


def average(values):
    """Return the arithmetic mean of a list of numbers."""
    return sum(values) / len(values)


def letter_grade(avg):
    """Convert an average score to a letter grade."""
    if avg >= 90:
        return "A"
    elif avg >= 80:
        return "B"
    elif avg >= 70:
        return "C"
    elif avg >= PASS_MARK:
        return "D"
    else:
        return "F"


def analyze(records):
    """Return per-student results and per-subject class averages."""
    results = []
    for record in records:
        scores = [record[subject] for subject in SUBJECTS]
        avg = average(scores)
        results.append({
            "name": record["name"],
            "scores": scores,
            "average": avg,
            "grade": letter_grade(avg),
            "passed": avg >= PASS_MARK,
        })

    subject_averages = {}
    for subject in SUBJECTS:
        subject_averages[subject] = average([record[subject] for record in records])

    return results, subject_averages


def print_report(results, subject_averages):
    """Print a readable text report."""
    line = "=" * 52
    print(line)
    print("STUDENT SCORES REPORT")
    print(line)
    print(f"{'Name':<10}{'Math':>6}{'Science':>9}{'English':>9}{'Avg':>7}  Grade")
    print("-" * 52)
    for r in results:
        math, science, english = r["scores"]
        print(f"{r['name']:<10}{math:>6}{science:>9}{english:>9}{r['average']:>7.1f}  {r['grade']}")
    print("-" * 52)
    print(f"{'Class avg':<10}"
          f"{subject_averages['math']:>6.1f}"
          f"{subject_averages['science']:>9.1f}"
          f"{subject_averages['english']:>9.1f}")
    print()

    # max() with key= picks the dictionary with the highest "average"
    top = max(results, key=lambda r: r["average"])
    passed = [r["name"] for r in results if r["passed"]]
    needs_support = [r["name"] for r in results if not r["passed"]]
    overall = average([r["average"] for r in results])

    print(f"Top student     : {top['name']} ({top['average']:.1f})")
    print(f"Class average   : {overall:.1f}")
    print(f"Passed ({len(passed)}/{len(results)})    : {', '.join(passed)}")
    print(f"Needs support   : {', '.join(needs_support) if needs_support else 'none'}")


def main():
    validate(students)
    results, subject_averages = analyze(students)
    print_report(results, subject_averages)


if __name__ == "__main__":
    main()
Expected output
====================================================
STUDENT SCORES REPORT
====================================================
Name        Math  Science  English    Avg  Grade
----------------------------------------------------
Amina         92       88       79   86.3  B
Youssef       75       81       68   74.7  C
Salma         58       64       71   64.3  D
Omar          85       90       94   89.7  B
Lina          67       55       62   61.3  D
Karim         99       95       87   93.7  A
Nadia         44       52       58   51.3  F
Hamza         73       70       77   73.3  C
----------------------------------------------------
Class avg   74.1     74.4     74.5

Top student     : Karim (93.7)
Class average   : 74.3
Passed (7/8)    : Amina, Youssef, Salma, Omar, Lina, Karim, Hamza
Needs support   : Nadia
You can verify the numbers by hand. Amina’s average is (92 + 88 + 79) / 3 = 259 / 3 = 86.3, which is a B. Nadia’s is (44 + 52 + 58) / 3 = 154 / 3 = 51.3, which is below 60, so she is the only student flagged for support. The class average is the mean of the eight student averages: 74.3.
How it works
- Constants at the top.
SUBJECTSandPASS_MARKare written in capital letters by convention. Changing them in one place updates the whole program. validate()checks every record before any calculation happens. It usesraise ValueError(...)to stop with a message that names the student and the problem.average()andletter_grade()are small functions that each do one job, which makes them easy to test and reuse.analyze()loops over the students, builds a result dictionary for each, and then computes per-subject averages with a second loop.print_report()uses f-string alignment such as{'Name':<10}(left-align in 10 characters) and{math:>6}(right-align in 6) to produce neat columns.max(results, key=lambda r: r["average"])finds the dictionary with the highest average. Thelambdais a one-line function that tellsmax()which value to compare.if __name__ == "__main__":runsmain()only when you execute the file directly, not when another file imports it.
Seeing validation work
Validation matters most when something goes wrong. This snippet feeds the validator an impossible score. Run it from the same folder as student_scores.py.
from student_scores import validate

bad_data = [{"name": "Test", "math": 105, "science": 80, "english": 70}]

try:
    validate(bad_data)
except ValueError as error:
    print("Validation error:", error)
Validation error: Test: math score 105 is outside 0-100A try/except block lets the program handle the error gracefully instead of crashing.
The same analysis with Pandas
Once you know Pandas, the calculation section shrinks dramatically. This version reuses the same students list.
import pandas as pd
from student_scores import students

subjects = ["math", "science", "english"]

df = pd.DataFrame(students)
df["average"] = df[subjects].mean(axis=1).round(1)

print(df[["name", "average"]].sort_values("average", ascending=False))
print()
print(df[subjects].mean().round(1))
name average
5 Karim 93.7
3 Omar 89.7
0 Amina 86.3
1 Youssef 74.7
7 Hamza 73.3
2 Salma 64.3
4 Lina 61.3
6 Nadia 51.3
math 74.1
science 74.4
english 74.5
dtype: float64Both versions agree on the averages. Pandas is the better choice as data grows, while the pure-Python version teaches you what is happening underneath.
Try it yourself
- Change
PASS_MARKto 65 and predict who will need support before you run the program. - Add a fourth subject,
history, toSUBJECTSand to every student record. - Add a student with a missing score and read the error message.
- Save the data as a CSV file and load it with
pd.read_csv(). - Draw a Seaborn bar chart of the averages.
Common Beginner Mistakes and How to Fix Them
Everyone makes these mistakes, and experienced programmers still make some of them. Python’s error messages are usually helpful: read the last line of the traceback first, because it names the error type and often tells you what went wrong.
1. Using = when you mean ==
A single = assigns a value. A double == compares two values.
if score = 60: # SyntaxError: invalid syntaxscore = 60
if score == 60:
print("Exactly the pass mark")Exactly the pass mark2. Wrong indentation
Python uses indentation to define blocks. Missing or inconsistent indentation causes an IndentationError.
if score >= 60:
print("Pass")      # IndentationError: expected an indented block
score = 75
if score >= 60:
print("Pass")PassUse four spaces for each level, and do not mix tabs and spaces. VS Code can convert tabs to spaces automatically.
3. Mixing strings and numbers
Text that looks like a number is still text. The input() function always returns a string, and values read from files often start as strings too.
score_text = "87"
print(score_text + 5)
TypeError: can only concatenate str (not "int") to strConvert the value first:
score_text = "87"
print(int(score_text) + 5)924. Counting from 1 instead of 0
List positions start at 0, so a list of three items has positions 0, 1, and 2.
scores = [92, 75, 58]
print(scores[3])
IndexError: list index out of rangeUse scores[-1] for the last item, or scores[len(scores) - 1].
scores = [92, 75, 58]
print(scores[-1])585. Looking up a missing dictionary key
student = {"name": "Amina", "math": 92}
print(student["history"])
KeyError: 'history'Check the spelling of the key, or use .get() with a default:
student = {"name": "Amina", "math": 92}
print(student.get("history", "no score yet"))
no score yet6. Forgetting to return
A function without a return statement gives back None, even if it calculates something inside.
def add_bonus(score):
    score + 5          # calculated, then thrown away


print(add_bonus(80))Nonedef add_bonus(score):
return score + 5
print(add_bonus(80))857. Expecting a copy when you only made a second name
Assigning one list to another variable does not copy the list. Both names point to the same object.
a = [1, 2, 3]
b = a
b.append(4)

print(a)
[1, 2, 3, 4]Use .copy() when you need an independent list:
a = [1, 2, 3]
b = a.copy()
b.append(4)

print(a)
print(b)
[1, 2, 3]
[1, 2, 3, 4]8. Import errors
If you see ModuleNotFoundError: No module named 'pandas', the library is not installed in the environment you are using. In Colab, run !pip install pandas in a cell. In VS Code, activate your virtual environment first, run pip install pandas, and make sure VS Code is using that environment as its Python interpreter.
A Realistic Learning Roadmap
Learning data science is a marathon of small steps. The path below is a sensible order, not a race. The time estimates assume roughly five to eight hours of practice per week and vary a lot from person to person.
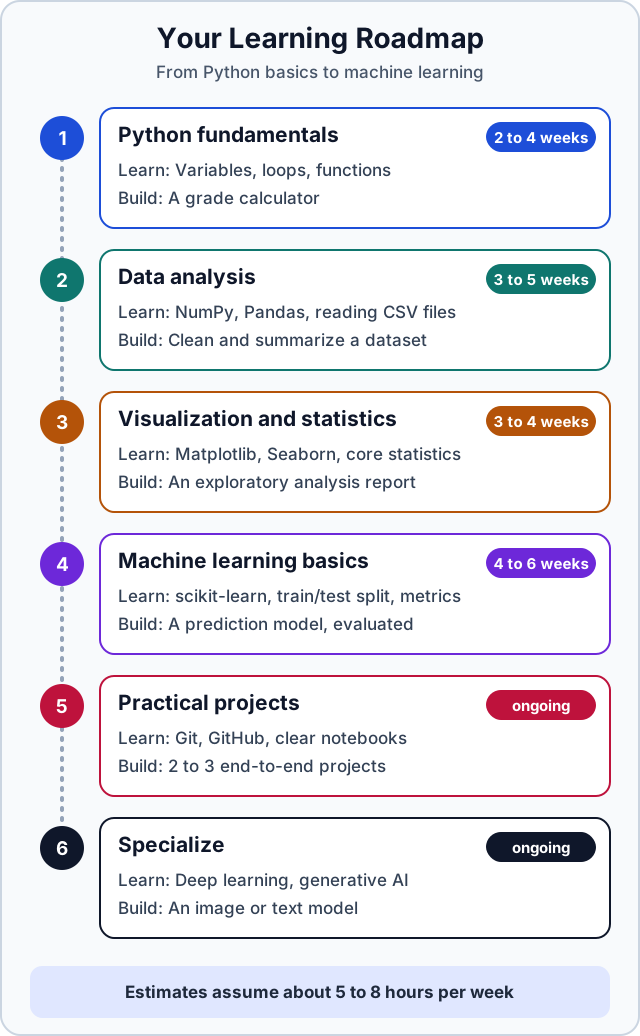
- Python fundamentals (2 to 4 weeks). Variables, data types, collections, conditions, loops, and functions. Build small programs such as a grade calculator or a unit converter.
- Data analysis (3 to 5 weeks). NumPy arrays, Pandas DataFrames, reading CSV files, handling missing values, filtering, and grouping. Clean and summarize a real dataset.
- Visualization and statistics (3 to 4 weeks). Matplotlib and Seaborn charts, plus core statistics: mean, median, variance, distributions, correlation, and basic probability. Write an exploratory analysis report.
- Machine learning basics (4 to 6 weeks). The scikit-learn workflow, train/test splits, regression and classification, and evaluation metrics. Learn why overfitting happens and how to detect it.
- Practical projects (ongoing). Build two or three end-to-end projects, from raw data to a conclusion. Learn Git and GitHub, keep notebooks readable, and write a short README for each project.
- Specialize (ongoing). Choose a direction: deep learning with PyTorch or TensorFlow, computer vision, natural language processing, or generative AI. By now you will have the foundation to learn them efficiently.
Two habits speed up progress more than any resource. First, type the code yourself instead of only reading it. Second, change something and see what breaks. Every error you fix teaches you more than a tutorial that works on the first try.
Conclusion
You have covered the core of Python for data science: how to run code, how data types behave, how to organize data in lists, tuples, and dictionaries, and how conditions, loops, and functions control a program. You have also met the five libraries you will use most, and you have built and checked a complete mini-project that validates data, calculates results, and prints a readable report.
The best next step is small and concrete. Re-type the mini-project from scratch without looking, then adapt it to data you care about, such as your own grades, expenses, or workout log. When you are ready, move on to Pandas and visualization with a real CSV file.
Further Reading
The official documentation is the most reliable and up-to-date source for each tool in this guide.
- The Python Tutorial: the official introduction to the language.
- Python downloads: install Python for your operating system.
- Google Colab: free hosted notebooks.
- Python in Visual Studio Code: the official getting-started guide for Python in VS Code.
- NumPy: absolute beginners guide
- Pandas: 10 minutes to pandas
- Matplotlib: quick start guide
- Seaborn: introduction
- scikit-learn: getting started
- PyTorch tutorials
- TensorFlow tutorials